
Weather forecasts are everywhere – on your phone, television, radio, and countless websites. But have you ever wondered why different sources sometimes give conflicting predictions, or what all those symbols and numbers actually mean? Understanding how to read weather forecasts like a professional meteorologist can help you make better decisions about your daily activities, travel plans, and safety preparations.
Understanding the Basics of Weather Forecasting
Before diving into specific symbols and terminology, it’s important to understand how weather forecasts are created. Modern weather prediction relies on sophisticated computer models that analyze millions of data points from weather stations, satellites, radar systems, and atmospheric balloons around the globe. These models use complex mathematical equations to simulate how the atmosphere will behave over time.
Meteorologists don’t just rely on one computer model – they typically analyze multiple models and use their expertise to interpret the data. This is why human meteorologists are still essential in the age of artificial intelligence. They can spot patterns, understand local weather quirks, and make adjustments that pure computer models might miss.
Decoding Weather Symbols and Icons
Most weather apps and websites use standardized symbols to represent different weather conditions. Here’s what the most common icons mean:
Sun and Cloud Combinations: A bright yellow sun represents clear, sunny conditions. When you see partial clouds covering the sun, this indicates partly cloudy skies with some sunshine breaking through. A sun peeking out from behind a cloud suggests mostly cloudy conditions with occasional sunny breaks.
Precipitation Symbols: Rain is typically shown as blue or gray diagonal lines or droplets. Light rain might be represented by just a few drops, while heavy rain shows multiple thick lines. Snow appears as white or light blue asterisks or crystalline shapes. Sleet combines rain and snow symbols, often showing both droplets and snowflakes.
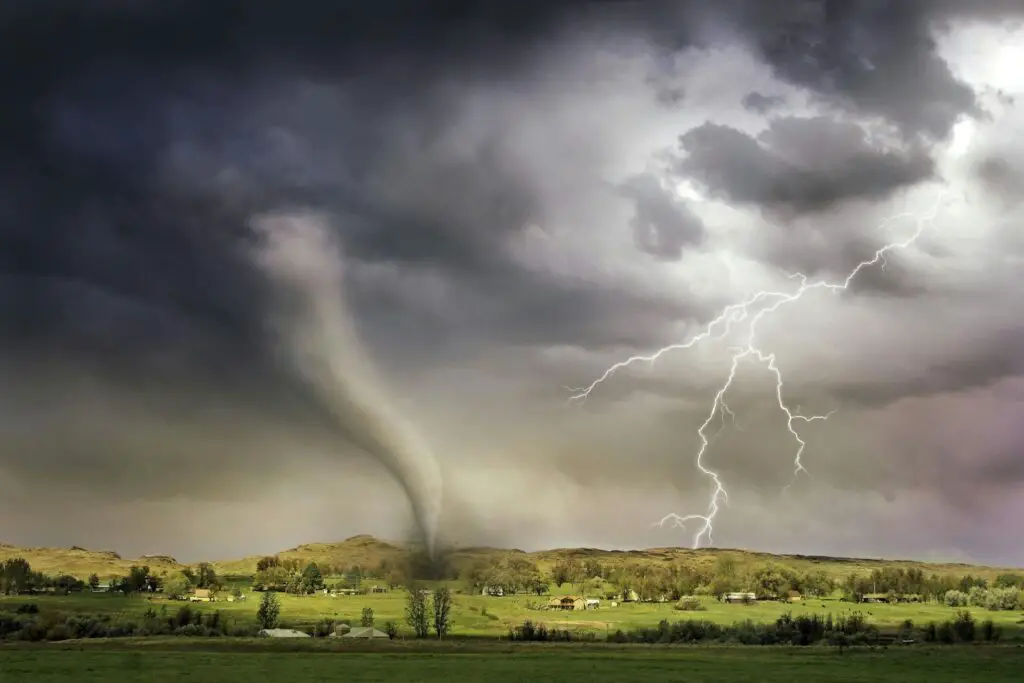
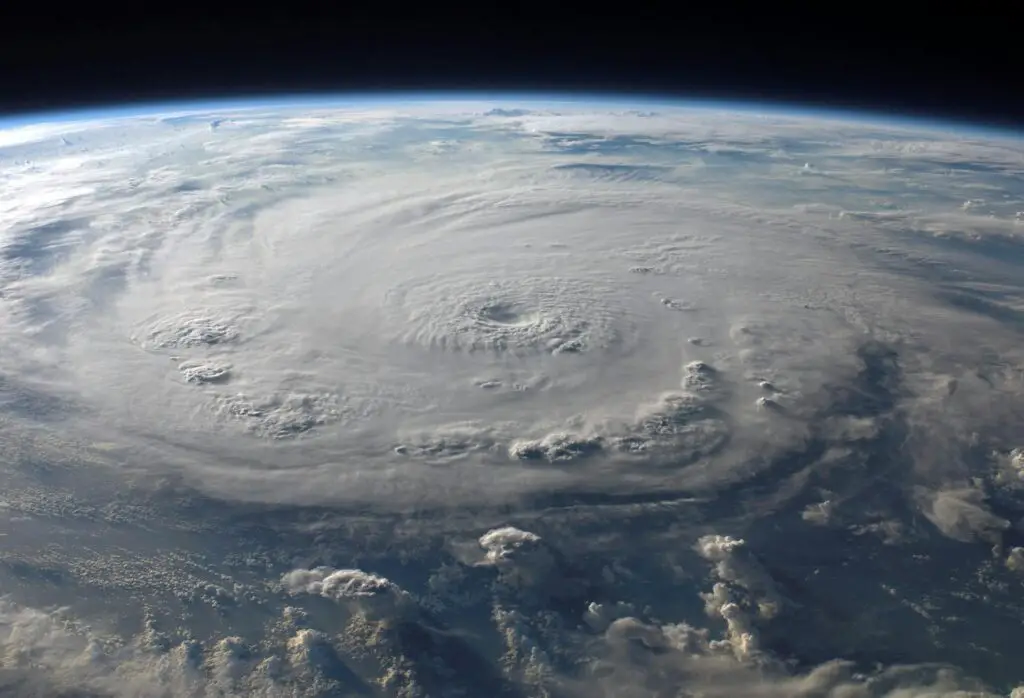
Severe Weather Icons: Lightning bolts indicate thunderstorms, and these may be combined with rain symbols for thundershowers. Tornado symbols appear as funnel-shaped spirals, while hurricane icons show large circular wind patterns. Fog is often represented by horizontal wavy lines or a cloud sitting close to the ground.
Temperature Readings: More Than Just Numbers
Temperature forecasts include several different measurements that each tell a different story about what you’ll actually experience outside.
High and Low Temperatures: The daily high represents the warmest temperature expected during the day, typically occurring in mid-to-late afternoon. The low temperature usually occurs just before sunrise. These figures help you plan what to wear and when to schedule outdoor activities.
Feels-Like Temperature: This crucial measurement accounts for humidity and wind effects on your body. During summer, high humidity makes temperatures feel hotter because sweat doesn’t evaporate efficiently. In winter, wind chill makes temperatures feel colder because moving air removes heat from your body more quickly.
Dew Point: This often-overlooked measurement indicates absolute humidity levels. When the dew point is above 65°F, most people find the air uncomfortably sticky. Below 55°F feels relatively dry and comfortable. The dew point also indicates when fog, dew, or frost might form.
Precipitation Probability: Understanding the Percentages
The percentage chance of precipitation is one of the most misunderstood aspects of weather forecasts. A 30% chance of rain doesn’t mean it will rain 30% of the time, nor does it mean 30% of the area will get rain.
This percentage actually represents the probability that any given point in the forecast area will receive measurable precipitation (at least 0.01 inches) during the forecast period. If there’s a 30% chance of rain, meteorologists are saying there’s a 30% probability that your specific location will get rain.
Timing Matters: Pay attention to when precipitation is expected. “Afternoon showers” suggests rain is most likely between noon and 6 PM. “Overnight rain” typically means precipitation between 6 PM and 6 AM. “Morning drizzle” indicates light rain is expected before noon.
Intensity Levels: Weather forecasts often include descriptors like “light,” “moderate,” or “heavy” precipitation. Light rain produces less than 0.1 inches per hour, moderate rain falls between 0.1 and 0.3 inches per hour, and heavy rain exceeds 0.3 inches per hour.
Wind Information: Direction and Speed
Wind forecasts provide both direction and speed information that’s crucial for many activities.
Wind Direction: This indicates where the wind is coming from, not where it’s going. A “north wind” blows from north to south. Wind direction is typically given in cardinal directions (N, NE, E, SE, S, SW, W, NW) or in degrees (0-360°, where 0° is north).
Wind Speed: Usually measured in miles per hour (mph) or kilometers per hour (km/h). Light winds are generally under 10 mph, moderate winds range from 10-25 mph, and strong winds exceed 25 mph. Sustained winds represent the average wind speed, while gusts indicate brief increases in wind speed.
Wind Chill and Heat Index: These measurements show how wind affects your perception of temperature. Wind chill applies during cold weather when wind makes temperatures feel colder. Heat index applies during hot weather when humidity makes temperatures feel hotter.
Barometric Pressure: The Invisible Indicator
Atmospheric pressure, measured in inches of mercury (inHg) or millibars (mb), provides valuable clues about approaching weather changes.
Rising Pressure: Generally indicates improving weather conditions. High pressure systems typically bring clear skies and stable conditions.
Falling Pressure: Often signals approaching storms or unsettled weather. Rapidly falling pressure can indicate severe weather is approaching.
Steady Pressure: Suggests weather conditions will remain relatively unchanged in the near term.
Normal sea-level pressure is approximately 30.00 inHg or 1013 mb. Significant deviations from this baseline often coincide with notable weather events.
Humidity and Comfort Levels
Relative humidity measures how much moisture the air contains compared to how much it could hold at that temperature. This percentage significantly affects comfort levels and weather conditions.
Low Humidity (below 30%): Makes air feel dry, can cause static electricity, and may lead to dry skin and respiratory irritation. Low humidity also increases fire danger and makes temperatures feel cooler.
Moderate Humidity (30-60%): Generally comfortable for most people and typical of pleasant weather conditions.
High Humidity (above 60%): Makes air feel sticky and oppressive, especially when combined with warm temperatures. High humidity also increases the likelihood of fog, dew, and precipitation.
Visibility and Air Quality
Visibility measurements indicate how far you can see clearly, which is crucial for driving and aviation safety.
Excellent Visibility: 10+ miles, typical of clear, dry conditions Good Visibility: 6-10 miles, normal for most weather conditions Fair Visibility: 3-6 miles, may indicate light haze or humidity Poor Visibility: Under 3 miles, often due to fog, rain, or snow
Air quality indices provide information about pollutant levels, which can affect sensitive individuals and outdoor activities.
Reading Weather Maps and Radar
Modern weather forecasts often include radar images and weather maps that provide additional context.
Radar Colors: Green typically indicates light precipitation, yellow shows moderate precipitation, orange represents heavy precipitation, and red indicates very heavy precipitation or severe weather.
Weather Fronts: Cold fronts appear as blue lines with triangles, warm fronts show as red lines with semicircles, and occluded fronts combine both symbols.
Pressure Systems: “H” marks high-pressure areas (usually associated with good weather), while “L” indicates low-pressure systems (often bringing clouds and precipitation).
Forecast Accuracy and Limitations
Understanding the limitations of weather forecasts helps set realistic expectations.
Accuracy by Time Frame: Today’s forecast is typically 90-95% accurate, tomorrow’s is about 85-90% accurate, and accuracy decreases significantly beyond five days. Seven-day forecasts are only about 65% accurate.
Geographic Specificity: Forecasts are most accurate for the specific location of weather stations. Microclimates, elevation changes, and proximity to water bodies can create different conditions within the same forecast area.
Seasonal Variations: Weather forecasts tend to be more accurate during stable weather patterns and less accurate during rapidly changing conditions or severe weather events.
Practical Applications
Armed with this knowledge, you can make better decisions about daily activities. Check multiple sources when planning important outdoor events, pay attention to timing details for precipitation, and always have backup plans for weather-dependent activities.
For severe weather, don’t just rely on apps – monitor official National Weather Service warnings and advisories. Understanding weather forecasts like a meteorologist means knowing when to trust the predictions and when to remain flexible as conditions change.
Weather forecasting remains a blend of science and art, combining sophisticated technology with human expertise and local knowledge. By understanding these fundamentals, you can interpret forecasts more effectively and make informed decisions based on weather conditions.
Here are 400 additional words you can add to the article:
Seasonal Forecast Considerations
Different seasons present unique forecasting challenges that affect accuracy and interpretation. Winter forecasts must account for the delicate balance between rain, sleet, and snow, which can change dramatically with just a few degrees of temperature variation. The “freezing line” – the altitude where temperatures drop to 32°F – determines precipitation type and can shift rapidly during winter storms.
Spring weather is notoriously difficult to predict due to the clash between warming and cooling air masses. This seasonal transition period often produces sudden temperature swings, unexpected late freezes, and rapidly developing severe weather. Pay extra attention to overnight low temperatures during spring, as they can drop unexpectedly and damage plants or create hazardous driving conditions.
Summer forecasts focus heavily on heat indices and severe weather potential. Afternoon thunderstorms are common but difficult to pinpoint precisely. Look for phrases like “scattered thunderstorms” which indicate isolated storms will develop, but their exact locations remain uncertain until just hours before formation.
Understanding Forecast Updates and Timing
Professional meteorologists update forecasts multiple times daily as new data becomes available. The National Weather Service typically issues new forecasts every six hours, with additional updates during severe weather events. Morning forecasts around 6 AM incorporate overnight observations, while afternoon updates around 3 PM reflect current conditions and trends.
Mobile weather apps may update even more frequently, sometimes every hour. However, constant updates don’t necessarily mean better accuracy – they often reflect minor adjustments rather than significant changes. Focus on the overall trend rather than minute-by-minute variations.
Regional and Local Influences
Geography plays a crucial role in weather patterns that computer models sometimes miss. Coastal areas experience sea breezes that can bring afternoon clouds or storms inland. Mountains create their own weather patterns through orographic lifting, causing increased precipitation on windward slopes and drier conditions on leeward sides.
Urban heat islands make cities several degrees warmer than surrounding rural areas, especially at night. Large bodies of water moderate temperatures, keeping nearby areas cooler in summer and warmer in winter. Valley locations often experience temperature inversions that trap fog and pollution.
Emergency Weather Preparedness
Understanding forecast terminology becomes critical during severe weather events. “Watches” indicate conditions are favorable for severe weather development, while “warnings” mean severe weather is imminent or occurring. “Advisories” suggest less severe but still impactful conditions.
When forecasts mention “rapidly intensifying” storms or “bomb cyclones,” these indicate weather systems that are strengthening quickly and may produce more severe conditions than initially predicted. Always have multiple ways to receive weather information during severe weather, as power outages can disable internet-dependent apps and services.